
Page 24 - Forum-2021-JanToMarch
P. 24
By Floris Gisolf, Dutch Safety Board Investigator and Data Analyst for the Maritime Department; Zeno
Geradts, Senior Forensic Scientist at the Netherlands Forensic Institute of the Ministry of Security and Justice
at the Forensic Digital Biometrics Traces Department; and Marcel Worring, Computer Science Professor,
University of Amsterdam
ANALYZING LARGE AND COMPLEX IMAGE COLLECTIONS
(Adapted with permission from the authors’ technical paper Analyzing Large and Complex Image Collections During a Safety Investigation presented
during ISASI 2019, Sept. 3–5, 2019, in The Hague, the Netherlands. The theme for ISASI 2019 was “Future Safety: Has the Past Become Irrelevant?” The
full presentation can be found on the ISASI website at www.isasi.org in the Library tab under Technical Presentations.—Editor)
n July 17, 2014, Flight MH17 tion can be used are also presented. shown on the image; it was hard to keep
crashed due to the detonation Image Analysis in the MH17 Crash track of which images had been seen by
of a warhead launched from the the investigators; our PCs and Windows
Oeastern part of Ukraine using a Investigation Explorer could not keep up with display-
Buk missile system. Because the remains The overarching question of the inves- ing large folders with many images; and
of the airplane were located in an area tigation was what happened to Flight going through all the images one by one
of ongoing armed conflict, it was not MH17. The main goal of the photo and was very time consuming.
possible to secure the physical investi- video analysis was to find which wreck- A software tool called Netclean Analyze
gation material, and an extensive inves- age pieces were found where. Once access (now known as Griffeye Analyze) was sug-
tigation could not be conducted at the was gained to the crash site, having this gested by Team High Tech Crime of the
crash site right away. For this reason, an information made it more efficient to Dutch police. This tool allows for quickly
important part of the investigation by decide which pieces to get and where to browsing through many images by gen-
the Dutch Safety Board consisted of the get them. Furthermore, it assisted in an- erating thumbnails, and it allows for tag-
manual analysis of the photos and videos swering the main question by providing ging images with multiple tags, which can
acquired by Ukrainian and Malaysian in- information about the breakup sequence subsequently be used to filter. It solved
vestigators, the Australian Federal Police, and the state of the wreckage pieces right several of the aforementioned problems.
the OCSE, journalists, and local people. after the crash. However, it was still time consuming, and
In total, approximately 20,000 photos and The analysis started fairly simplistic by the interface to tag images was somewhat
3,000 videos were collected. filtering out unwanted files (e.g., nonim- cumbersome, requiring multiple clicks.
In this paper, the photo and video anal- age files, thumbnails, low flight resolu- The image and video analysis resulted
ysis performed by the Dutch Safety Board tion images) and by sorting images into in several “products” for the investigation
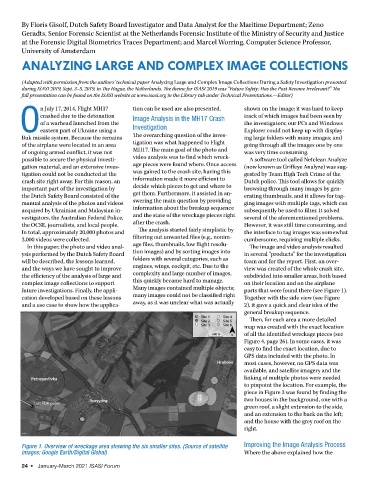
will be described, the lessons learned, folders with several categories, such as team and for the report. First, an over-
and the ways we have sought to improve engines, wings, cockpit, etc. Due to the view was created of the whole crash site,
the efficiency of the analysis of large and complexity and large number of images, subdivided into smaller areas, both based
complex image collections to support this quickly became hard to manage. on their location and on the airplane
future investigations. Finally, the appli- Many images contained multiple objects; parts that were found there (see Figure 1).
cation developed based on these lessons many images could not be classified right Together with the side view (see Figure
and a use case to show how the applica- away, as it was unclear what was actually 2), it gave a quick and clear idea of the
general breakup sequence.
Then, for each area a more detailed
map was created with the exact location
of all the identified wreckage pieces (see
Figure 4, page 26). In some cases, it was
easy to find the exact location, due to
GPS data included with the photo. In
most cases, however, no GPS data was
available, and satellite imagery and the
linking of multiple photos were needed
to pinpoint the location. For example, the
piece in Figure 3 was found by finding the
two houses in the background, one with a
green roof, a slight extension to the side,
and an extension to the back on the left;
and the house with the grey roof on the
right.
Figure 1. Overview of wreckage area showing the six smaller sites. (Source of satellite Improving the Image Analysis Process
images: Google Earth/Digital Global) Where the above explained how the
24 • January-March 2021 ISASI Forum