
Page 12 - Forum-2021-JanToMarch
P. 12
error tunnel (blue).
To better compare the difference be-
tween both, the extrapolated flight path
from the video method and the recorded
flight path from the FDR, the distance
was calculated in feet and shown along
the time in Figure 13. The solid blue line
describes the difference in latitude and
longitude in feet between the reconstruct-
ed position and the recorded FDR data.
The graph with dotted blue line shows the
maximum possible distance, known as
Figure 12. Recovered black box (left) and ADS-B flight path data (right). error tunnel, based on the formulas. The
achieved accuracy of the reconstructed
flight path was in a range of between 50
and 150 feet, finally within the error tun-
nel (see Figure 13).
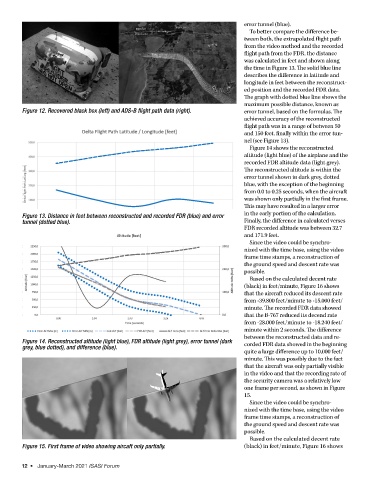
Figure 14 shows the reconstructed
altitude (light blue) of the airplane and the
recorded FDR altitude data (light grey).
The reconstructed altitude is within the
error tunnel shown in dark grey, dotted
blue, with the exception of the beginning
from 0.0 to 0.25 seconds, when the aircraft
was shown only partially in the first frame.
This may have resulted in a larger error
Figure 13. Distance in feet between reconstructed and recorded FDR (blue) and error in the early portion of the calculation.
tunnel (dotted blue). Finally, the difference in calculated verses
FDR recorded altitude was between 32.7
and 171.9 feet.
Since the video could be synchro-
nized with the time base, using the video
frame time stamps, a reconstruction of
the ground speed and descent rate was
possible.
Based on the calculated decent rate
(black) in feet/minute, Figure 16 shows
that the aircraft reduced its descent rate
from -39.800 feet/minute to -15.000 feet/
minute. The recorded FDR data showed
that the B-767 reduced its decend rate
from -28.000 feet/minute to -18.240 feet/
minute within 2 seconds. The difference
between the reconstructed data and re-
Figure 14. Reconstructed altitude (light blue), FDR altitude (light grey), error tunnel (dark corded FDR data showed in the beginning
grey, blue dotted), and difference (blue).
quite a large difference up to 10,000 feet/
minute. This was possibly due to the fact
that the aircraft was only partially visible
in the video and that the recording rate of
the security camera was a relatively low
one frame per second, as shown in Figure
15.
Since the video could be synchro-
nized with the time base, using the video
frame time stamps, a reconstruction of
the ground speed and descent rate was
possible.
Based on the calculated decent rate
Figure 15. First frame of video showing aircaft only partially. (black) in feet/minute, Figure 16 shows
12 • January-March 2021 ISASI Forum